From publicly available data to custom data we collect, we can create maps formatted for your unique situation.
Click and hold the center arrows as you move left to right to see how the trail system, marked in red, interacts with the ortho map.
Below are some more detailed explanations of the types of maps we can produce with GIS mapping. What do you want mapped? Contact us to discuss your situation and how we can best meet your mapping needs.
Making Maps
Here, we have plotted 2 different sets of slash piles to be burned in winter. These are shown by the blue and yellow dots. You can also see “stand” lines, in red, that outline where different management is slated to take place on the property. The underlying photo is what we captured with our drone to make a current orthomosiac. Look closely and you can actually see the piles under the dots.
Data Analysis
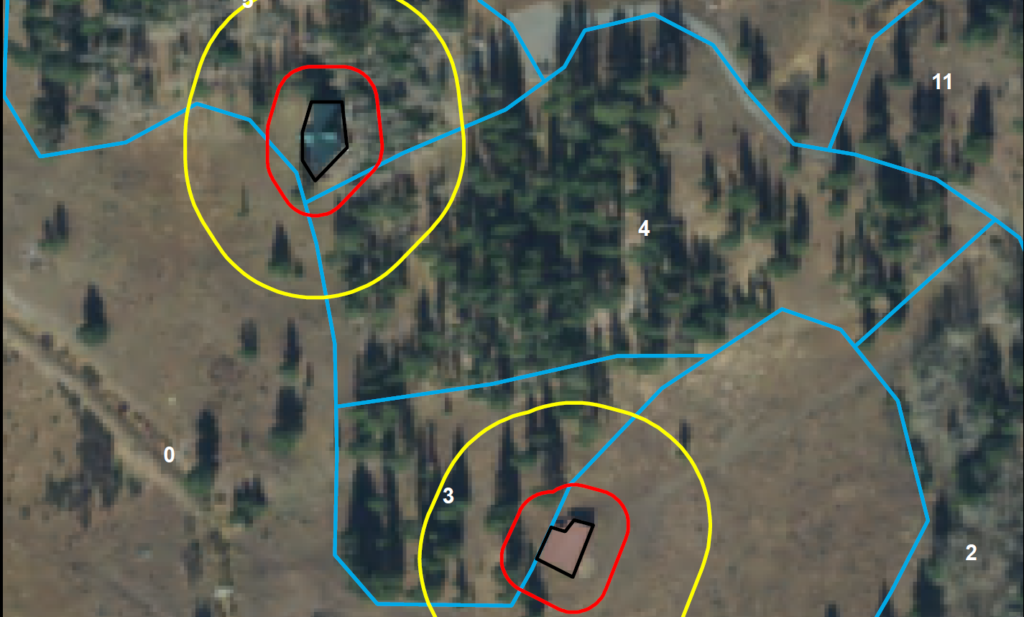
In this example, we identified structures, specifically a house and a barn. By using buffer analysis, we can show the distances needed for proper wildfire fuel mitigation as it relates to defensible space around structures. The red lines show a 30 foot buffer and the yellow lines are the 100 foot buffer from the structures.
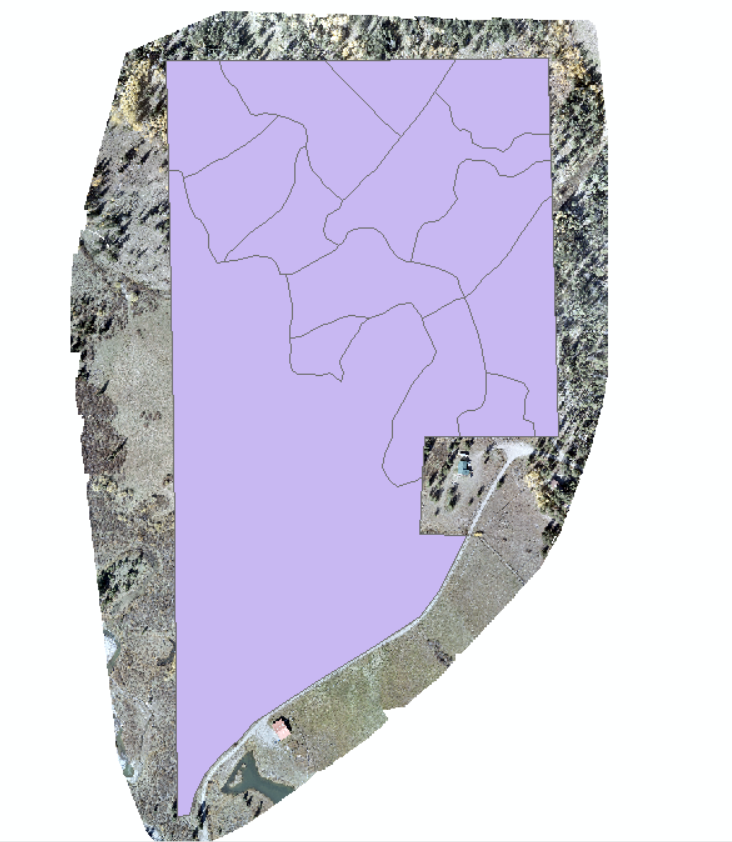
Here is a typical property boundary that we have worked with the landowner to subdivide the property into management units.
Next, we make the layer transparent and changed the line color so we can see the underlying photo, You can now start to see some basis for why the management units were created. There are open, grassy areas, units that are mostly aspen, and others that are mostly conifer such as pine and spruce.
We can further define this data layer and color-code the management units to give a visual representation of what is happening on the ground. In this case, green is open. Blue is for aspen management and the tan is conifer management.
You can also use this same thing to define pasture or hay management such as rotations, grass or hay crop, winter versus summer, fertilized or not.
We can also add in other data layers that you may be interested in. This property has an extensive trail system that the client wanted mapped out. We used both an on the ground GPS data collector and the new photo from our drone to define where exactly the trails were and plotted them with the red dashes. The green circle with an X were locations of gates.