MultiSpectral Analysis

Looking across the light spectrum allows us to perform additional analysis of your property.

Multispectral imagery is simply the way objects reflect light differently. This difference can be seen both by our eyes and sensors. What we do here is translate the reflected light into usable data that tells us more about the land and vegetation below. 

Multispectral Analysis

Here is a multispectral analysis of a hay field that only had one side fertilized. The red coloring is a total lack of vegetation. This shows us the roads, ponds, and bare earth in and around the field. Green is healthy vegetation while yellows and oranges are stressed vegetation. With this, we can identify where the farmer should concentrate their remaining fertilizer. 

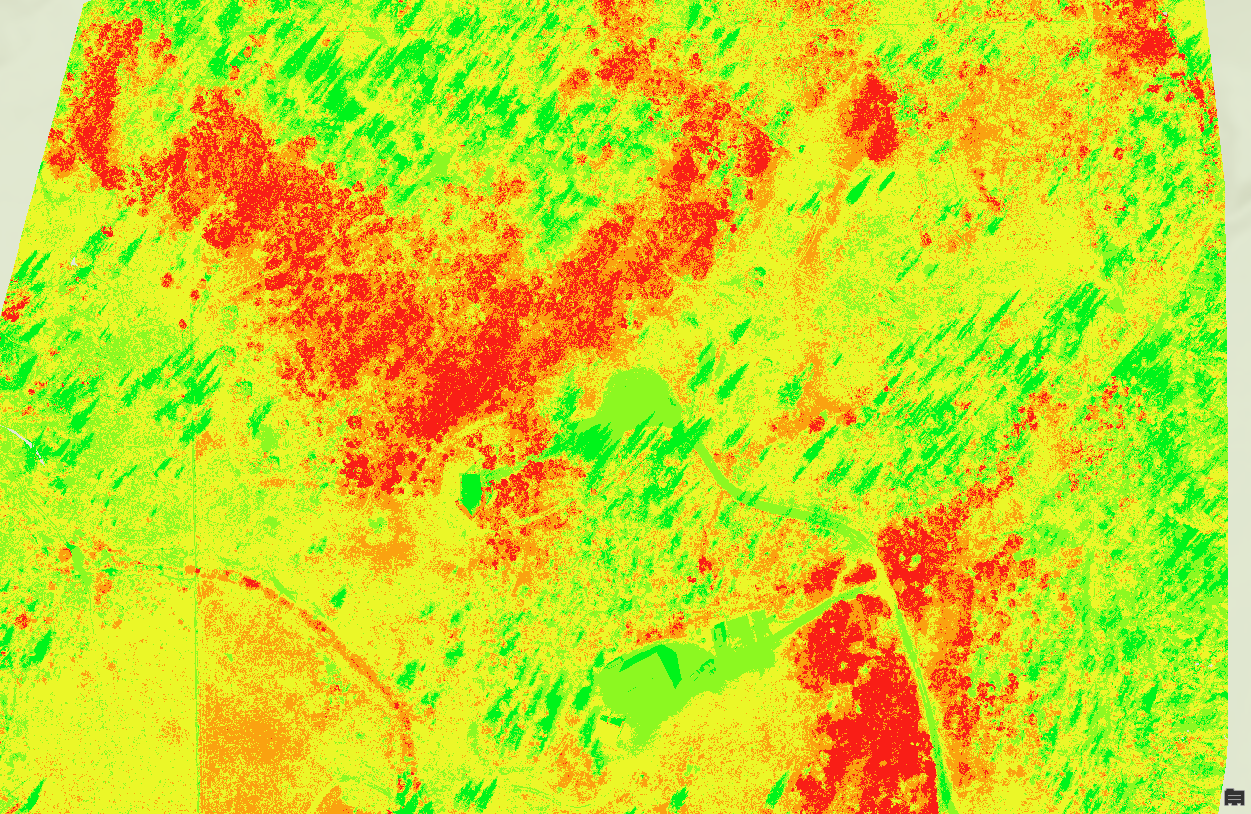
This multispectral is oriented to analyze tree health. While using different spectral bands in the NVDI analysis, we can isolate healthy vs stressed vegetation. Using this technology as an early warning system, we can identify problems and possible solutions before the tree stress becomes fatal, as the multispectral view provides information not visible to the naked eye.

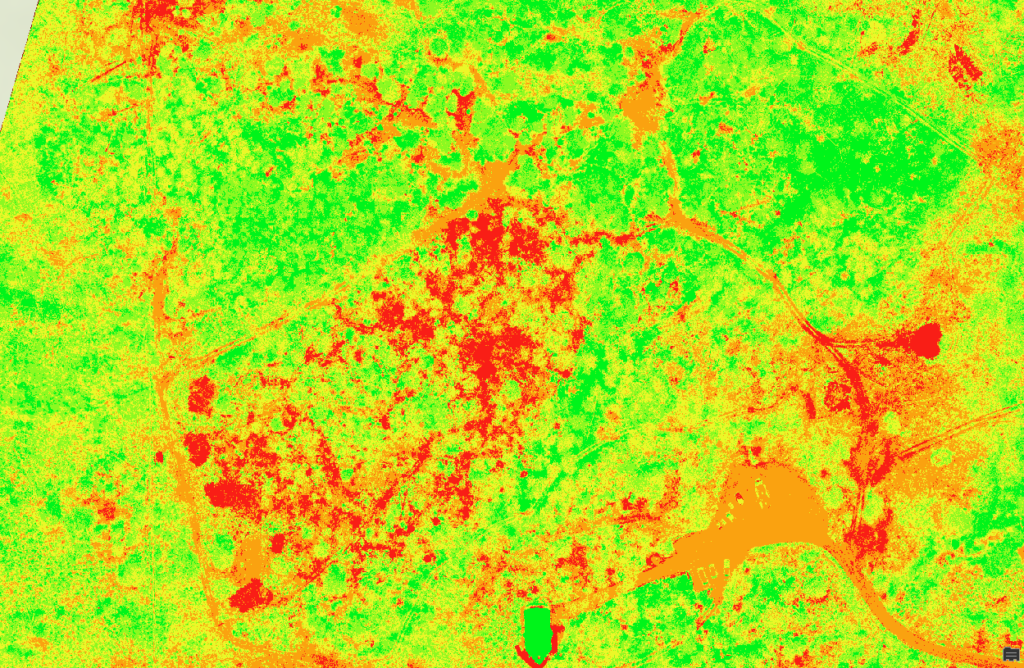
Here we have highlighted both healthy and stressed tree canopies with the blue lines. Specifically, the dark red tree on the right side had roots that were buried with fill dirt and is causing stress. While the red circled tree on the left is infested with Emerald Ash Borer (EAB). Unfortunately, the tree will be dead within 2 years, but this information gives the landowner time to plan for the tree removal before it becomes severely compromised and a threat to the neighboring shed. 

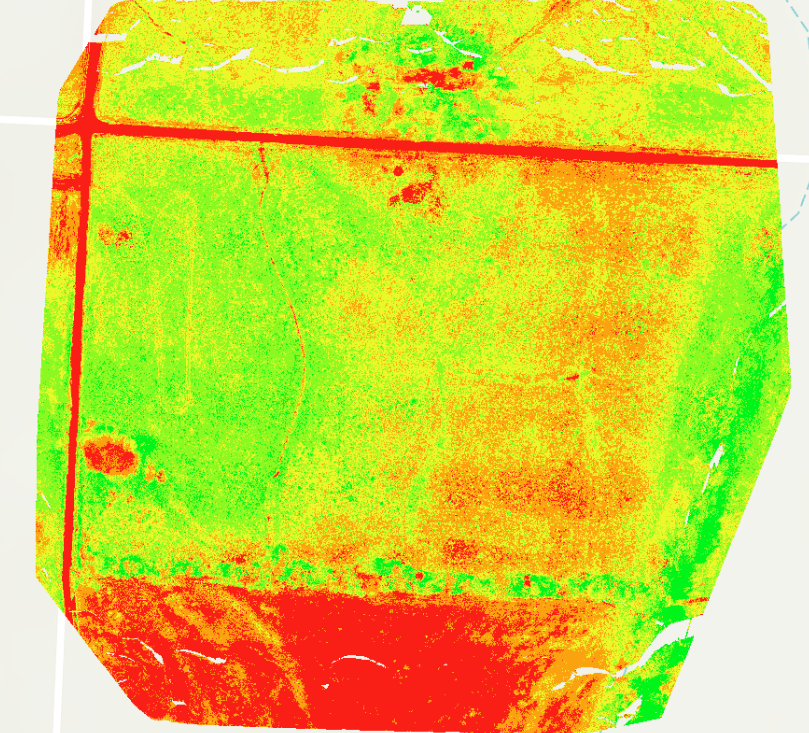
The large circled tree that has a lot of orange on the lower right of the image is showing signs of stress. In this case, the effects of herbicide damage from the adjacent crop fields.

The next two are multispectral images of the same property at different times of the year. Depending on the time of year, vegetation can drastically change how it reflects light. Sometimes we can see this change and other times we need the aid of special cameras to reveal what might be happening. It should be noted that red isn’t always bad in these images. They are sorted into colors that we can identify as opposed to those outside the visible spectrum. 

The October image was processed in order to isolate aspen. The aspen were bright yellow, indicating that the photosynthesis was done, therefore, the leaves reflect light different than pine or spruce needles and grass that has gone completely dormant. You can even see individual trees on the edge.

For the July image, we moved the spectral bands around to show damaged plant material in red. This was mainly slash piles where the cut trees and branches were placed. You can also see damaged grasses in the trails surrounding the management unit.

With a quick consultation, we can figure out the best way that a multispectral analysis can help provide a Solution to a question or problem you want solved.

October, Red is aspen.
July, Red shows slash piles and disturbed/damaged vegetation.

Here one of our pilots, Nate, is preparing to fly a multispectral orthomosaic.